logo

Here you can check the predicted and actual wait times for . You can find the latest 7-day wait time trend and the historical average wait times.

September 7, 2025

Current Wait Status

Wait Time
  • N/A
  • 55
    min. (max.)
  • 33
    min. (avg.)
Operating Conditions
  • 10:00am (Normal Operation Begins)
    Operating

Update today at 9:00 am

Forecast and Actual Wait Time

September 7, 2025
chart

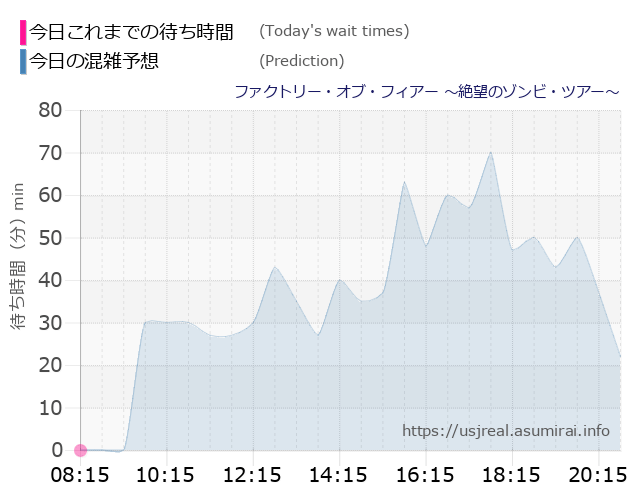
Please note that this chart is an image and cannot be translated.


Waiting Time This Week

  1. TIME
  2. Mon. Sep. 1
  3. Tue. Sep. 2
  4. Wed. Sep. 3
  5. Thu. Sep. 4
  6. Fri. Sep. 5
  7. Sat. Sep. 6
  8. Sun. Sep. 7
  1. 07:15
  2. -
  3. -
  1. 07:45
  2. -
  3. -
  1. 08:15
  2. -
  3. -
  1. 08:45
  2. -
  3. -
  1. 09:15
  2. -
  3. -
  1. 09:45
  2. -
  3. -
  1. 10:15
  2. -
  1. 10:45
  1. 11:15
  1. 11:45
  1. 12:15
  1. 12:45
  1. 13:15
  1. 13:45
  1. 14:15
  1. 14:45
  1. 15:15
  1. 15:45
  1. 16:15
  1. 16:45
  1. 17:15
  1. 17:45
  1. 18:15
  1. 18:45
  1. 19:15
  1. 19:45
  1. 20:15
  1. 20:45
  1. 21:15
  1. 21:45
  2. -

Average Waiting Time by Day

September 2025

diagram

August 2025

diagram

July 2025

diagram

June 2025

diagram

Please note that the these diagrams are images and cannot be translated.