logo

SING ON TOUR

Here you can check the predicted and actual wait times for SING ON TOUR. You can find the latest 7-day wait time trend and the historical average wait times.

February 4, 2026

Current Wait Status

Wait Time
  • N/A
Operating Conditions
  • 11:00am-5:15pm Normal Operation

Update today at 11:52 am

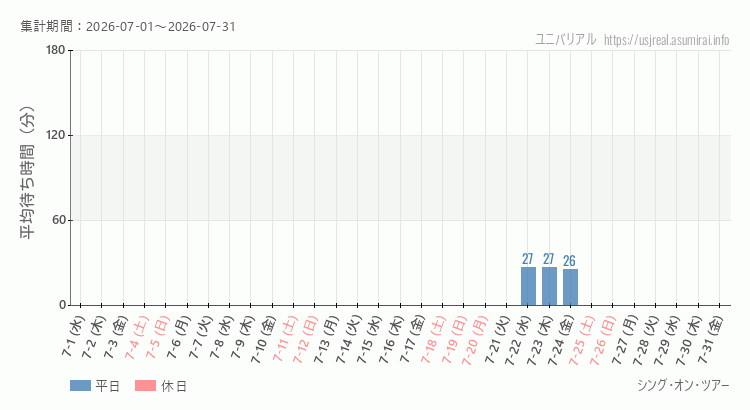
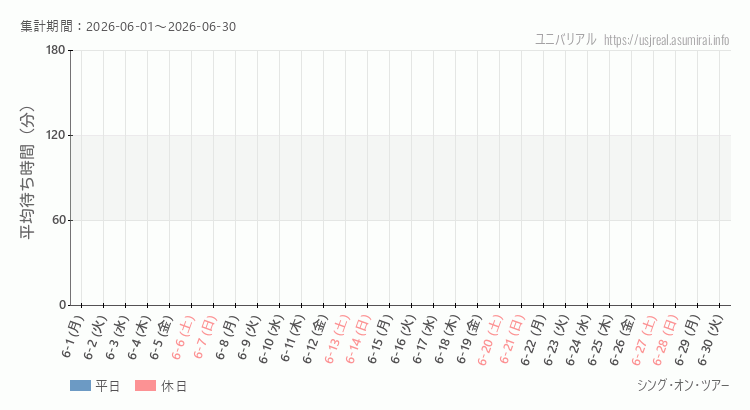
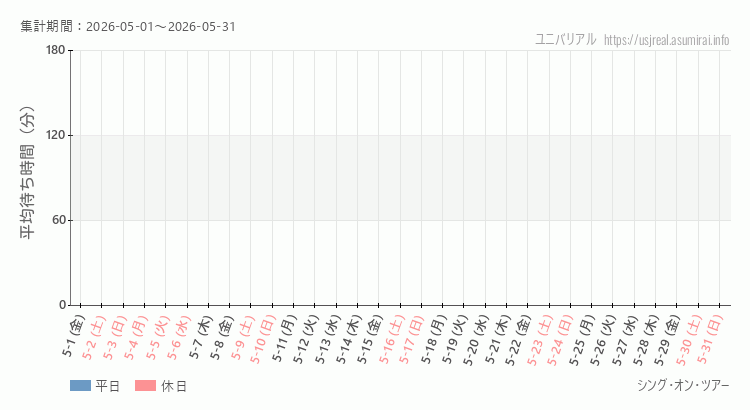
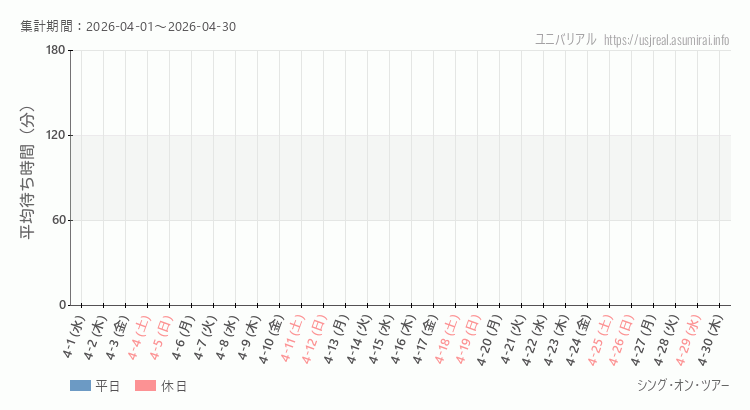
Forecast and Actual Wait Time

February 4, 2026
chart

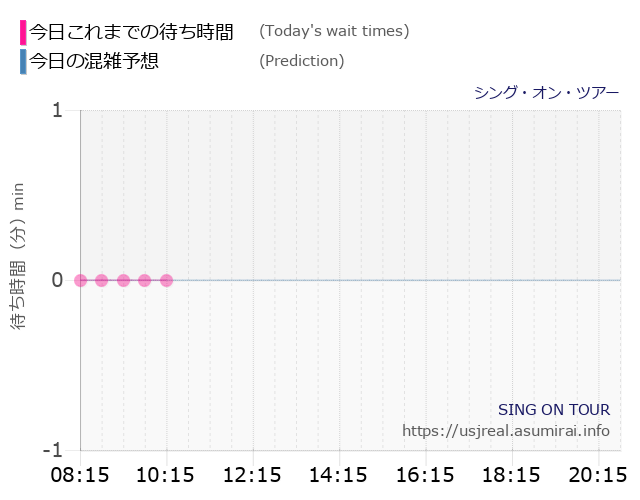
Please note that this chart is an image and cannot be translated.

SING ON TOUR
Waiting Time This Week

  1. TIME
  2. Thu. Jan. 29
  3. Fri. Jan. 30
  4. Sat. Jan. 31
  5. Sun. Feb. 1
  6. Mon. Feb. 2
  7. Tue. Feb. 3
  8. Wed. Feb. 4
  1. 07:15
  2. -
  3. -
  4. -
  5. -
  6. -
  7. -
  8. -
  1. 07:45
  2. -
  3. -
  4. -
  5. -
  6. -
  7. -
  8. -
  1. 08:15
  2. -
  3. -
  4. -
  5. -
  6. -
  7. -
  8. -
  1. 08:45
  2. -
  3. -
  4. -
  5. -
  6. -
  7. -
  8. -
  1. 09:15
  2. -
  3. -
  4. -
  5. -
  6. -
  7. -
  8. -
  1. 09:45
  2. -
  3. -
  4. -
  5. -
  6. -
  7. -
  8. -
  1. 10:15
  2. -
  3. -
  4. -
  5. -
  6. -
  7. -
  8. -
  1. 10:45
  2. -
  3. -
  4. -
  5. -
  6. -
  7. -
  8. -
  1. 11:15
  2. -
  3. -
  4. -
  5. -
  6. -
  7. -
  8. -
  1. 11:45
  2. -
  3. -
  4. -
  5. -
  6. -
  7. -
  8. -
  1. 12:15
  2. -
  3. -
  4. -
  5. -
  6. -
  7. -
  8. -
  1. 12:45
  2. -
  3. -
  4. -
  5. -
  6. -
  7. -
  8. -
  1. 13:15
  2. -
  3. -
  4. -
  5. -
  6. -
  7. -
  8. -
  1. 13:45
  2. -
  3. -
  4. -
  5. -
  6. -
  7. -
  8. -
  1. 14:15
  2. -
  3. -
  4. -
  5. -
  6. -
  7. -
  8. -
  1. 14:45
  2. -
  3. -
  4. -
  5. -
  6. -
  7. -
  8. -
  1. 15:15
  2. -
  3. -
  4. -
  5. -
  6. -
  7. -
  8. -
  1. 15:45
  2. -
  3. -
  4. -
  5. -
  6. -
  7. -
  8. -
  1. 16:15
  2. -
  3. -
  4. -
  5. -
  6. -
  7. -
  8. -
  1. 16:45
  2. -
  3. -
  4. -
  5. -
  6. -
  7. -
  8. -
  1. 17:15
  2. -
  3. -
  4. -
  5. -
  6. -
  7. -
  8. -
  1. 17:45
  2. -
  3. -
  4. -
  5. -
  6. -
  7. -
  8. -
  1. 18:15
  2. -
  3. -
  4. -
  5. -
  6. -
  7. -
  8. -
  1. 18:45
  2. -
  3. -
  4. -
  5. -
  6. -
  7. -
  8. -
  1. 19:15
  2. -
  3. -
  4. -
  5. -
  6. -
  7. -
  8. -
  1. 19:45
  2. -
  3. -
  4. -
  5. -
  6. -
  7. -
  8. -
  1. 20:15
  2. -
  3. -
  4. -
  5. -
  6. -
  7. -
  8. -
  1. 20:45
  2. -
  3. -
  4. -
  5. -
  6. -
  7. -
  8. -
  1. 21:15
  2. -
  3. -
  4. -
  5. -
  6. -
  7. -
  8. -
  1. 21:45
  2. -
  3. -
  4. -
  5. -
  6. -
  7. -
  8. -

Average Waiting Time by Day

February 2026

diagram

January 2026

diagram

December 2025

diagram

November 2025

diagram

Please note that the these diagrams are images and cannot be translated.